Chapter 8 Multivariate Statistics and Principle Components Analysis
“I’ve been searching for college courses about correlation studies… but I can’t find the best fit.”
A lot of data that we try to analyze is multivariate, meaning that the data has multiple records or observations with multiple variables. There are various ways to look at this type of data and describe associations of variables. We may describe associations through covariance or a correlation coefficient. Principle Components Analysis (PCA) is a useful tool for looking at correlation that uses orthogonal transformation to convert observations with potentially correlated variables into a set of values of linearly uncorrelated variables (called principal components). In order to explore PCA as a tool, we looked at wine and how variables of wine are correlated with one another.
Data and assignment provided by Dr. Michael Lefsky of Colorado State University.
8.1 Scatterplot matrix of variables
# generate a scatterplot of variables 2 to 6 where each cultivar is shown in a different color
pairs(wine[,2:6], main = "Wine Data -- 3 cultivars",
      pch = 21, bg = c("red", "green3", "blue")[unclass(wine$cultivar)])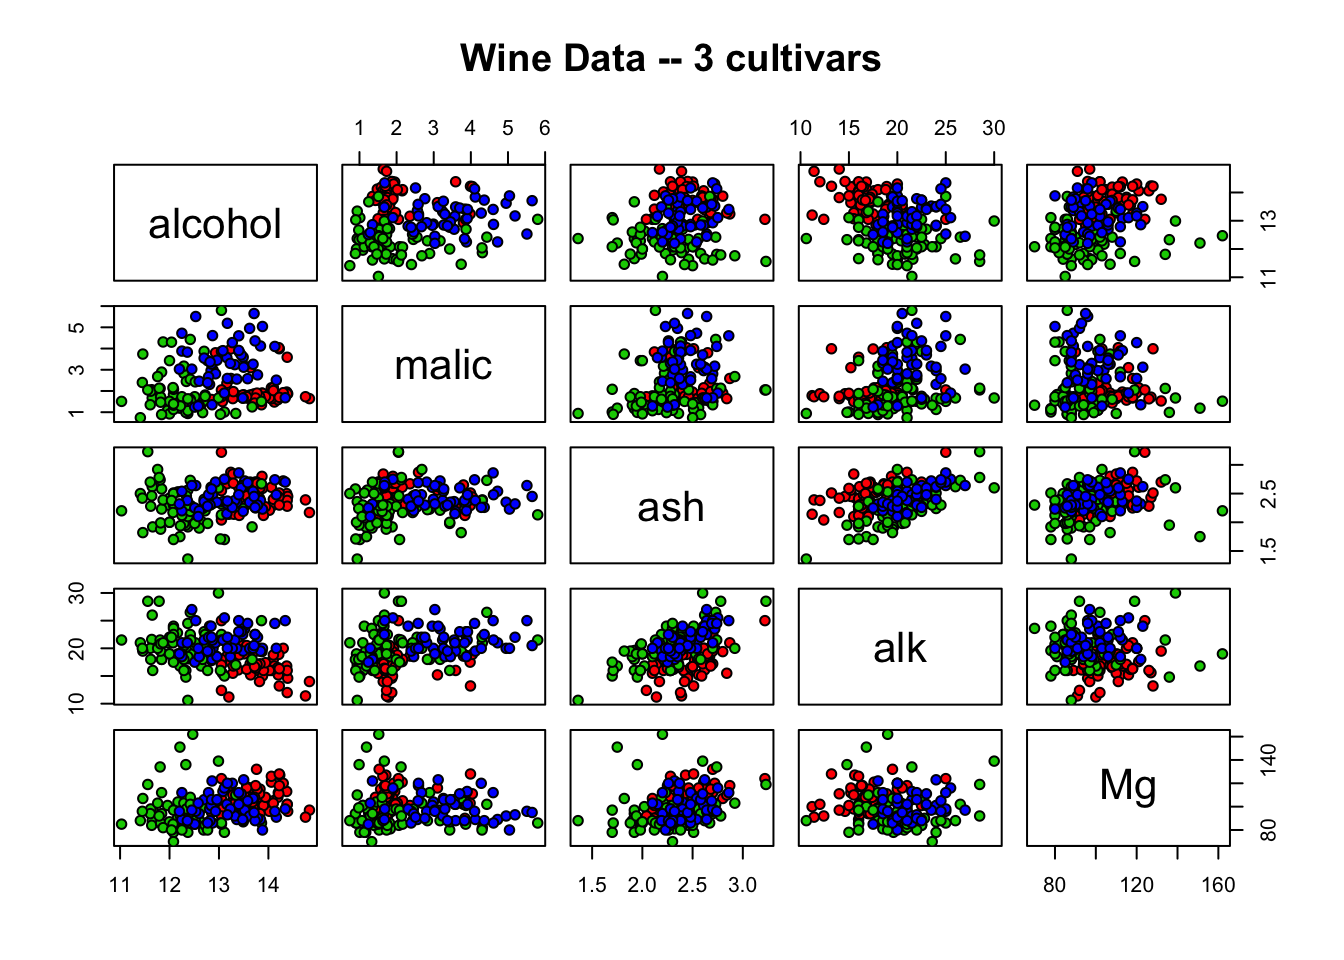
Figure 8.1: Scatterplot matrix demonstrating the relationships between five variables for three wine cultivars. Alcohol, malic acid (malic), ash, alkalinity of ash (alk), and magnesium (Mg) are plotted together on both x and y axes for cultivar 1 (red), cultivar 2 (green), and cultivar 3 (blue). Groupings demonstrate association between variables.
From the above plot, alcohol and alkalinity don’t seem to have a very strong linear relationship, but it appears that the weak correlation is negative, with alkalinity decreasing as alcohol increases and vice versa. Ash and alkalinity seem to have a slightly stronger linear relationship that is positive; as ash increases, so does alkalinity, and vice versa.
8.2 Correlation matrix
# Generate a correlation matrix between variables 2 to 14
cor(wine[,2:14])
## alcohol malic ash alk Mg
## alcohol 1.00000000 0.09439694 0.211544596 -0.31023514 0.27079823
## malic 0.09439694 1.00000000 0.164045470 0.28850040 -0.05457510
## ash 0.21154460 0.16404547 1.000000000 0.44336719 0.28658669
## alk -0.31023514 0.28850040 0.443367187 1.00000000 -0.08333309
## Mg 0.27079823 -0.05457510 0.286586691 -0.08333309 1.00000000
## totphen 0.28910112 -0.33516700 0.128979538 -0.32111332 0.21440123
## flavan 0.23681493 -0.41100659 0.115077279 -0.35136986 0.19578377
## nonflavphen -0.15592947 0.29297713 0.186230446 0.36192172 -0.25629405
## proantho 0.13669791 -0.22074619 0.009651935 -0.19732684 0.23644061
## color 0.54636420 0.24898534 0.258887259 0.01873198 0.19995001
## hue -0.07174720 -0.56129569 -0.074666889 -0.27395522 0.05539820
## OD 0.07234319 -0.36871043 0.003911231 -0.27676855 0.06600394
## proline 0.64372004 -0.19201056 0.223626264 -0.44059693 0.39335085
## totphen flavan nonflavphen proantho color
## alcohol 0.28910112 0.2368149 -0.1559295 0.136697912 0.54636420
## malic -0.33516700 -0.4110066 0.2929771 -0.220746187 0.24898534
## ash 0.12897954 0.1150773 0.1862304 0.009651935 0.25888726
## alk -0.32111332 -0.3513699 0.3619217 -0.197326836 0.01873198
## Mg 0.21440123 0.1957838 -0.2562940 0.236440610 0.19995001
## totphen 1.00000000 0.8645635 -0.4499353 0.612413084 -0.05513642
## flavan 0.86456350 1.0000000 -0.5378996 0.652691769 -0.17237940
## nonflavphen -0.44993530 -0.5378996 1.0000000 -0.365845099 0.13905701
## proantho 0.61241308 0.6526918 -0.3658451 1.000000000 -0.02524993
## color -0.05513642 -0.1723794 0.1390570 -0.025249931 1.00000000
## hue 0.43368134 0.5434786 -0.2626396 0.295544253 -0.52181319
## OD 0.69994936 0.7871939 -0.5032696 0.519067096 -0.42881494
## proline 0.49811488 0.4941931 -0.3113852 0.330416700 0.31610011
## hue OD proline
## alcohol -0.07174720 0.072343187 0.6437200
## malic -0.56129569 -0.368710428 -0.1920106
## ash -0.07466689 0.003911231 0.2236263
## alk -0.27395522 -0.276768549 -0.4405969
## Mg 0.05539820 0.066003936 0.3933508
## totphen 0.43368134 0.699949365 0.4981149
## flavan 0.54347857 0.787193902 0.4941931
## nonflavphen -0.26263963 -0.503269596 -0.3113852
## proantho 0.29554425 0.519067096 0.3304167
## color -0.52181319 -0.428814942 0.3161001
## hue 1.00000000 0.565468293 0.2361834
## OD 0.56546829 1.000000000 0.3127611
## proline 0.23618345 0.312761075 1.0000000Correlation matrix for variables for wine, including alcohol, malic acid (malic), ash, alkalinity of ash (alk), magnesium (Mg), total phenol (totphen), flavonoids (flavan), nonflavanoid phenols (nonflavphen), proanthocyanins (proantho), color intensity (color), hue, OD280/OD315 of diluted wines (OD), and proline.
8.3 Calculate variances
# Calculate variances for variables 2 to 14 for all variables together
var(wine[,2:14]) # the diagonal values in the matrix are variances
## alcohol malic ash alk Mg
## alcohol 0.65906233 0.08561131 0.0471151590 -0.8410929 3.1398781
## malic 0.08561131 1.24801540 0.0502770393 1.0763317 -0.8707795
## ash 0.04711516 0.05027704 0.0752646353 0.4062083 1.1229366
## alk -0.84109290 1.07633171 0.4062082778 11.1526862 -3.9747604
## Mg 3.13987812 -0.87077953 1.1229365835 -3.9747604 203.9893354
## totphen 0.14688722 -0.23433772 0.0221455913 -0.6711491 1.9164699
## flavan 0.19203322 -0.45863037 0.0315347299 -1.1720828 2.7930870
## nonflavphen -0.01575426 0.04073336 0.0063584714 0.1504219 -0.4555634
## proantho 0.06351752 -0.14114698 0.0015155780 -0.3771762 1.9328325
## color 1.02828254 0.64483818 0.1646543266 0.1450242 6.6205206
## hue -0.01331344 -0.14332564 -0.0046821545 -0.2091181 0.1808513
## OD 0.04169782 -0.29244748 0.0007618358 -0.6562344 0.6693081
## proline 164.56718498 -67.54886657 19.3197390973 -463.3553450 1769.1586999
## totphen flavan nonflavphen proantho color
## alcohol 0.14688722 0.19203322 -0.015754260 0.063517520 1.02828254
## malic -0.23433772 -0.45863037 0.040733362 -0.141146982 0.64483818
## ash 0.02214559 0.03153473 0.006358471 0.001515578 0.16465433
## alk -0.67114915 -1.17208281 0.150421856 -0.377176220 0.14502419
## Mg 1.91646988 2.79308703 -0.455563385 1.932832476 6.62052061
## totphen 0.39168954 0.54047042 -0.035045125 0.219373345 -0.07999752
## flavan 0.54047042 0.99771867 -0.066867000 0.373147553 -0.39916863
## nonflavphen -0.03504512 -0.06686700 0.015488634 -0.026059868 0.04012051
## proantho 0.21937334 0.37314755 -0.026059868 0.327594668 -0.03350392
## color -0.07999752 -0.39916863 0.040120510 -0.033503918 5.37444938
## hue 0.06203888 0.12408197 -0.007471177 0.038664565 -0.27650580
## OD 0.31102128 0.55826225 -0.044469244 0.210932940 -0.70581258
## proline 98.17105726 155.44749222 -12.203586301 59.554333778 230.76748014
## hue OD proline
## alcohol -0.013313443 0.0416978226 164.56718
## malic -0.143325638 -0.2924474830 -67.54887
## ash -0.004682155 0.0007618358 19.31974
## alk -0.209118054 -0.6562343681 -463.35535
## Mg 0.180851266 0.6693080683 1769.15870
## totphen 0.062038876 0.3110212785 98.17106
## flavan 0.124081969 0.5582622548 155.44749
## nonflavphen -0.007471177 -0.0444692440 -12.20359
## proantho 0.038664565 0.2109329398 59.55433
## color -0.276505801 -0.7058125762 230.76748
## hue 0.052244961 0.0917662439 17.00022
## OD 0.091766244 0.5040864089 69.92753
## proline 17.000223386 69.9275255507 99166.71736By testing the variances of variables, we can look at whether they need to be standardized in order to get an accurate representation of variable influence in a PCA. In this case, we do need to standardize, because the variances are quite different between variables.
8.4 Standardizing variables
# You can standardize variables in R using the "scale()" function
wine.standardized <-as.data.frame(scale(wine[,2:14]))

sapply(wine.standardized, mean) # for calculating mean of all variables
## alcohol malic ash alk Mg
## -8.591766e-16 -6.776446e-17 8.045176e-16 -7.720494e-17 -4.073935e-17
## totphen flavan nonflavphen proantho color
## -1.395560e-17 6.958263e-17 -1.042186e-16 -1.221369e-16 3.649376e-17
## hue OD proline
## 2.093741e-16 3.003459e-16 -1.034429e-16sapply(wine.standardized, var) # for calculating variance of all variables## alcohol malic ash alk Mg totphen
## 1 1 1 1 1 1
## flavan nonflavphen proantho color hue OD
## 1 1 1 1 1 1
## proline
## 18.5 PCA on standardized data
#Perform PCA on standardized data
wine.pca <- prcomp(wine.standardized)

# print summary of the PCA
summary(wine.pca)
## Importance of components:
## PC1 PC2 PC3 PC4 PC5 PC6 PC7
## Standard deviation 2.169 1.5802 1.2025 0.95863 0.92370 0.80103 0.74231
## Proportion of Variance 0.362 0.1921 0.1112 0.07069 0.06563 0.04936 0.04239
## Cumulative Proportion 0.362 0.5541 0.6653 0.73599 0.80162 0.85098 0.89337
## PC8 PC9 PC10 PC11 PC12 PC13
## Standard deviation 0.59034 0.53748 0.5009 0.47517 0.41082 0.32152
## Proportion of Variance 0.02681 0.02222 0.0193 0.01737 0.01298 0.00795
## Cumulative Proportion 0.92018 0.94240 0.9617 0.97907 0.99205 1.00000screeplot(wine.pca)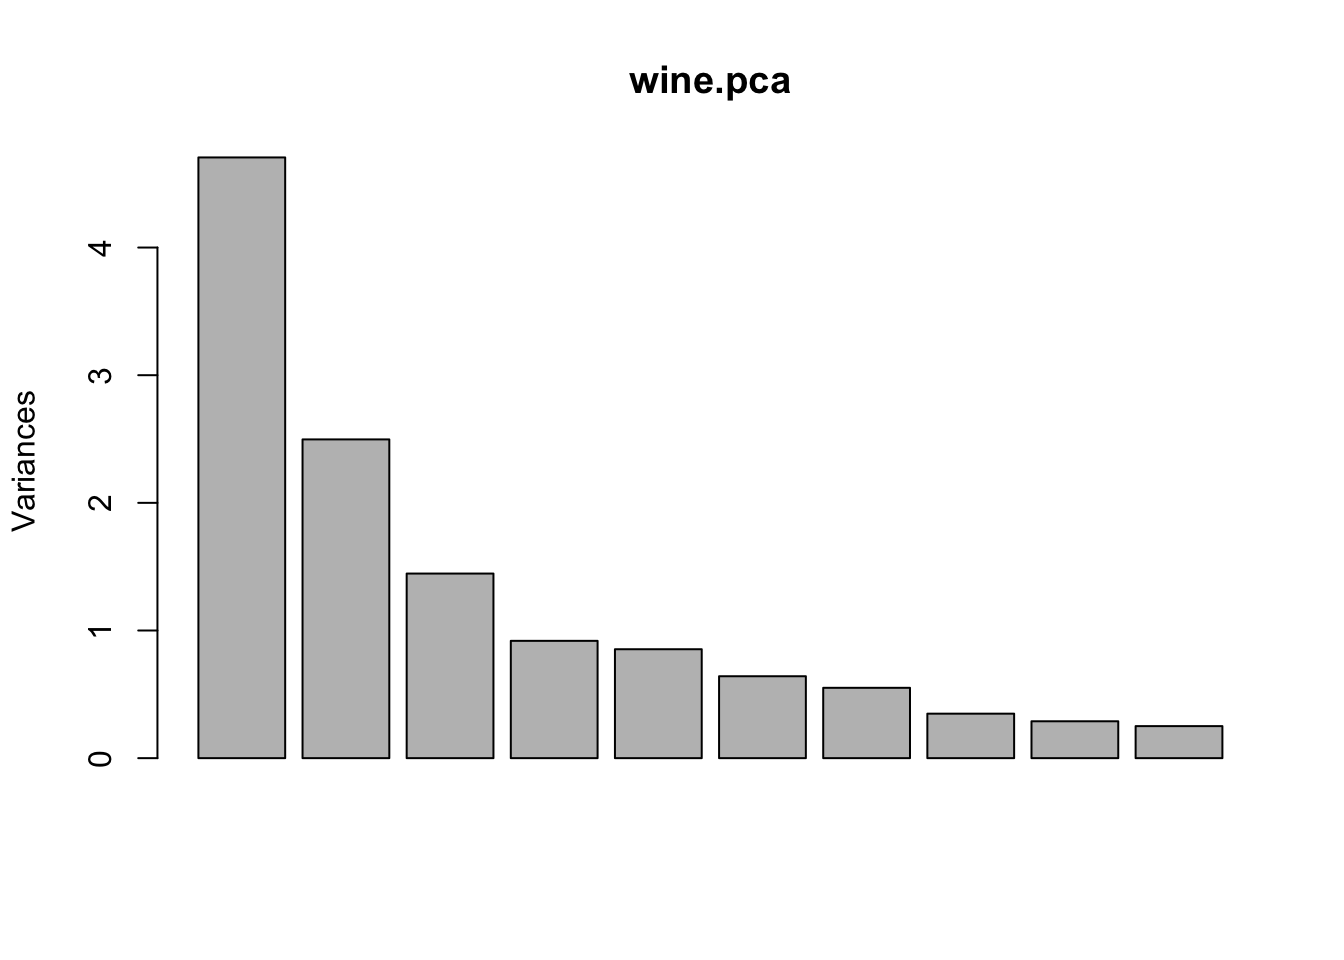
Figure 8.2: Screeplot summary of variances in standardized data.
# Examine the loadings from the standardized data
wine.pca$rotation
## PC1 PC2 PC3 PC4 PC5
## alcohol -0.144329395 0.483651548 -0.20738262 0.01785630 -0.26566365
## malic 0.245187580 0.224930935 0.08901289 -0.53689028 0.03521363
## ash 0.002051061 0.316068814 0.62622390 0.21417556 -0.14302547
## alk 0.239320405 -0.010590502 0.61208035 -0.06085941 0.06610294
## Mg -0.141992042 0.299634003 0.13075693 0.35179658 0.72704851
## totphen -0.394660845 0.065039512 0.14617896 -0.19806835 -0.14931841
## flavan -0.422934297 -0.003359812 0.15068190 -0.15229479 -0.10902584
## nonflavphen 0.298533103 0.028779488 0.17036816 0.20330102 -0.50070298
## proantho -0.313429488 0.039301722 0.14945431 -0.39905653 0.13685982
## color 0.088616705 0.529995672 -0.13730621 -0.06592568 -0.07643678
## hue -0.296714564 -0.279235148 0.08522192 0.42777141 -0.17361452
## OD -0.376167411 -0.164496193 0.16600459 -0.18412074 -0.10116099
## proline -0.286752227 0.364902832 -0.12674592 0.23207086 -0.15786880
## PC6 PC7 PC8 PC9 PC10
## alcohol 0.21353865 -0.05639636 0.39613926 -0.50861912 0.21160473
## malic 0.53681385 0.42052391 0.06582674 0.07528304 -0.30907994
## ash 0.15447466 -0.14917061 -0.17026002 0.30769445 -0.02712539
## alk -0.10082451 -0.28696914 0.42797018 -0.20044931 0.05279942
## Mg 0.03814394 0.32288330 -0.15636143 -0.27140257 0.06787022
## totphen -0.08412230 -0.02792498 -0.40593409 -0.28603452 -0.32013135
## flavan -0.01892002 -0.06068521 -0.18724536 -0.04957849 -0.16315051
## nonflavphen -0.25859401 0.59544729 -0.23328465 -0.19550132 0.21553507
## proantho -0.53379539 0.37213935 0.36822675 0.20914487 0.13418390
## color -0.41864414 -0.22771214 -0.03379692 -0.05621752 -0.29077518
## hue 0.10598274 0.23207564 0.43662362 -0.08582839 -0.52239889
## OD 0.26585107 -0.04476370 -0.07810789 -0.13722690 0.52370587
## proline 0.11972557 0.07680450 0.12002267 0.57578611 0.16211600
## PC11 PC12 PC13
## alcohol 0.22591696 -0.26628645 0.01496997
## malic -0.07648554 0.12169604 0.02596375
## ash 0.49869142 -0.04962237 -0.14121803
## alk -0.47931378 -0.05574287 0.09168285
## Mg -0.07128891 0.06222011 0.05677422
## totphen -0.30434119 -0.30388245 -0.46390791
## flavan 0.02569409 -0.04289883 0.83225706
## nonflavphen -0.11689586 0.04235219 0.11403985
## proantho 0.23736257 -0.09555303 -0.11691707
## color -0.03183880 0.60422163 -0.01199280
## hue 0.04821201 0.25921400 -0.08988884
## OD -0.04642330 0.60095872 -0.15671813
## proline -0.53926983 -0.07940162 0.01444734# Examine the biplot which shows the loadings in the first 2 principal components
biplot(wine.pca)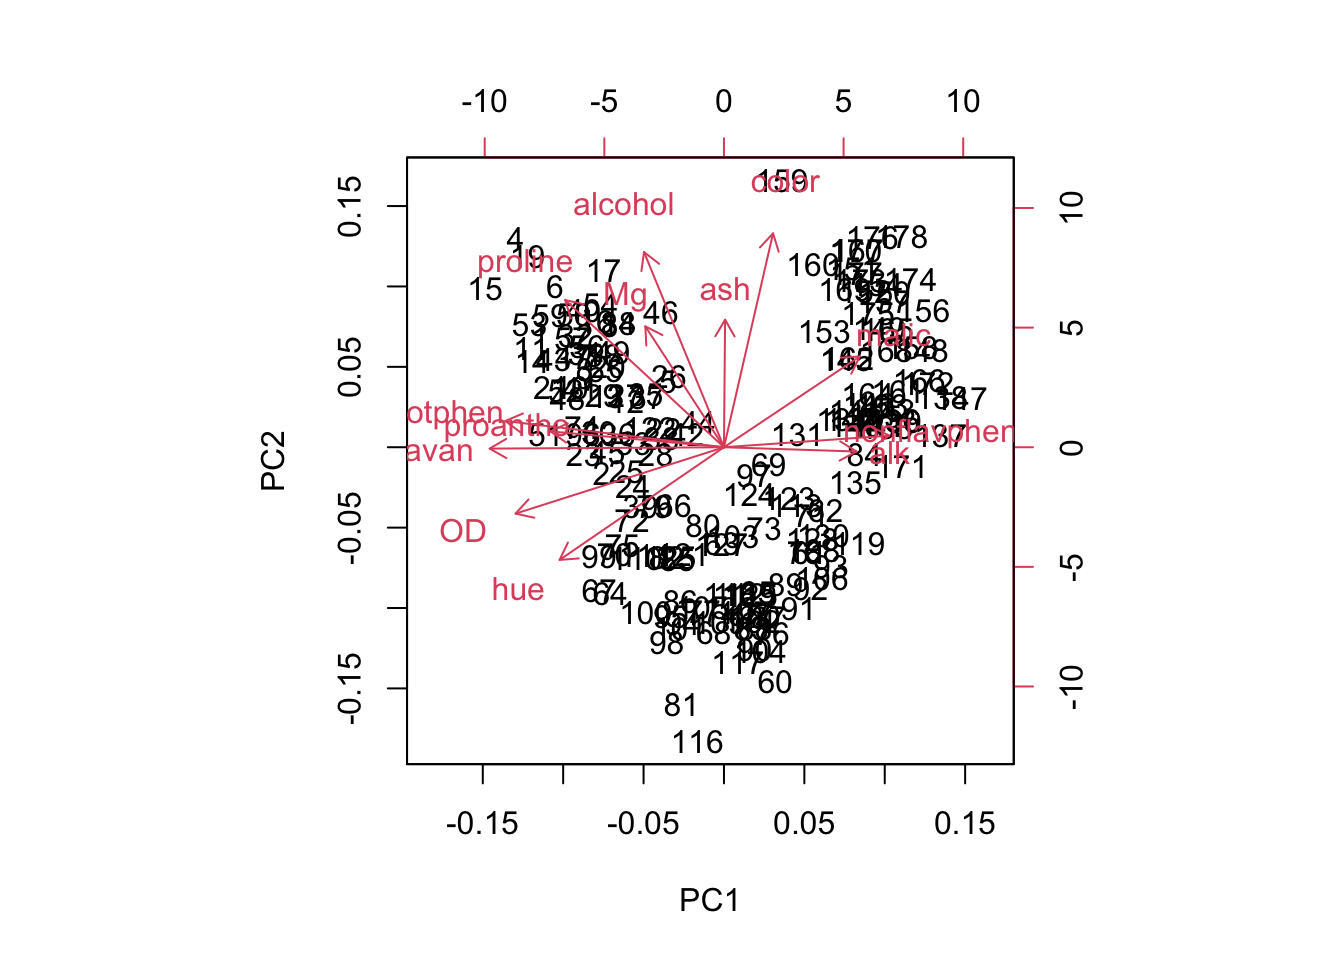
Figure 8.3: Biplot of the first two principal components for standardized data of three wine cultivars (1-59, 60-130, and 131-178), and loadings for variables alcohol, malic acid (malic), ash, alkalinity of ash (alk), magnesium (Mg), total phenol (totphen), flavonoids (flavan), nonflavanoid phenols (nonflavphen), proanthocyanins (proantho), color intensity (color), hue, OD280/OD315 of diluted wines (OD), and proline.
# Save the variable loadings to a .csv file
#write.csv(wine.pca$rotation, file="wine_pca_loadings.csv")
# Plot the scores from PC1 and PC2 and add labels
plot(wine.pca$x[,1], wine.pca$x[,2], main="Scores from PC1 and PC2")
text(wine.pca$x[,1], wine.pca$x[,2], wine$cultivar,cex=0.7,pos=4,col="red") #add labels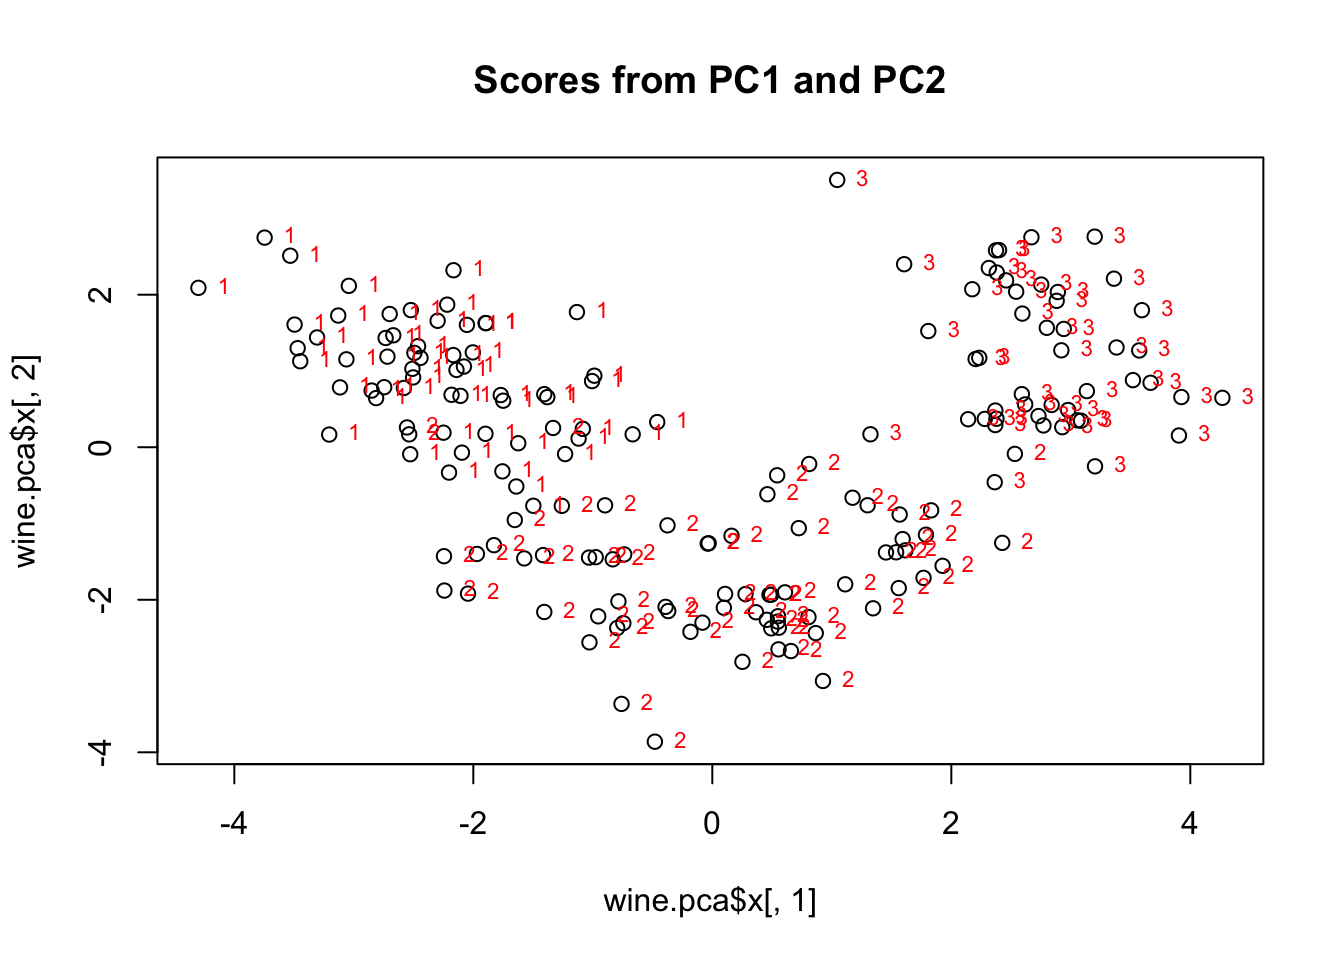
Figure 8.4: Scatterplot of principal component scores for standardized data of three wine cultivars (1, 2, 3). The first principal component scores are on the x axis, and the second principal component scores are on the y axis. Cultivar 1 is grouped in the upper left, with majority negative scores for principal component 1 and positive scores for principal component 2. Cultivar 2 is grouped with negative scores for principal component 2 and between -2 and 3 for principal component 1. Cultivar 3 is grouped in mostly positive scores for both components.
# Plot the scores from PC3 and PC4 and add labels
plot(wine.pca$x[,3], wine.pca$x[,4], main="Scores from PC3 and PC4")
text(wine.pca$x[,3], wine.pca$x[,4], wine$cultivar,cex=0.7,pos=4,col="red")   #add labels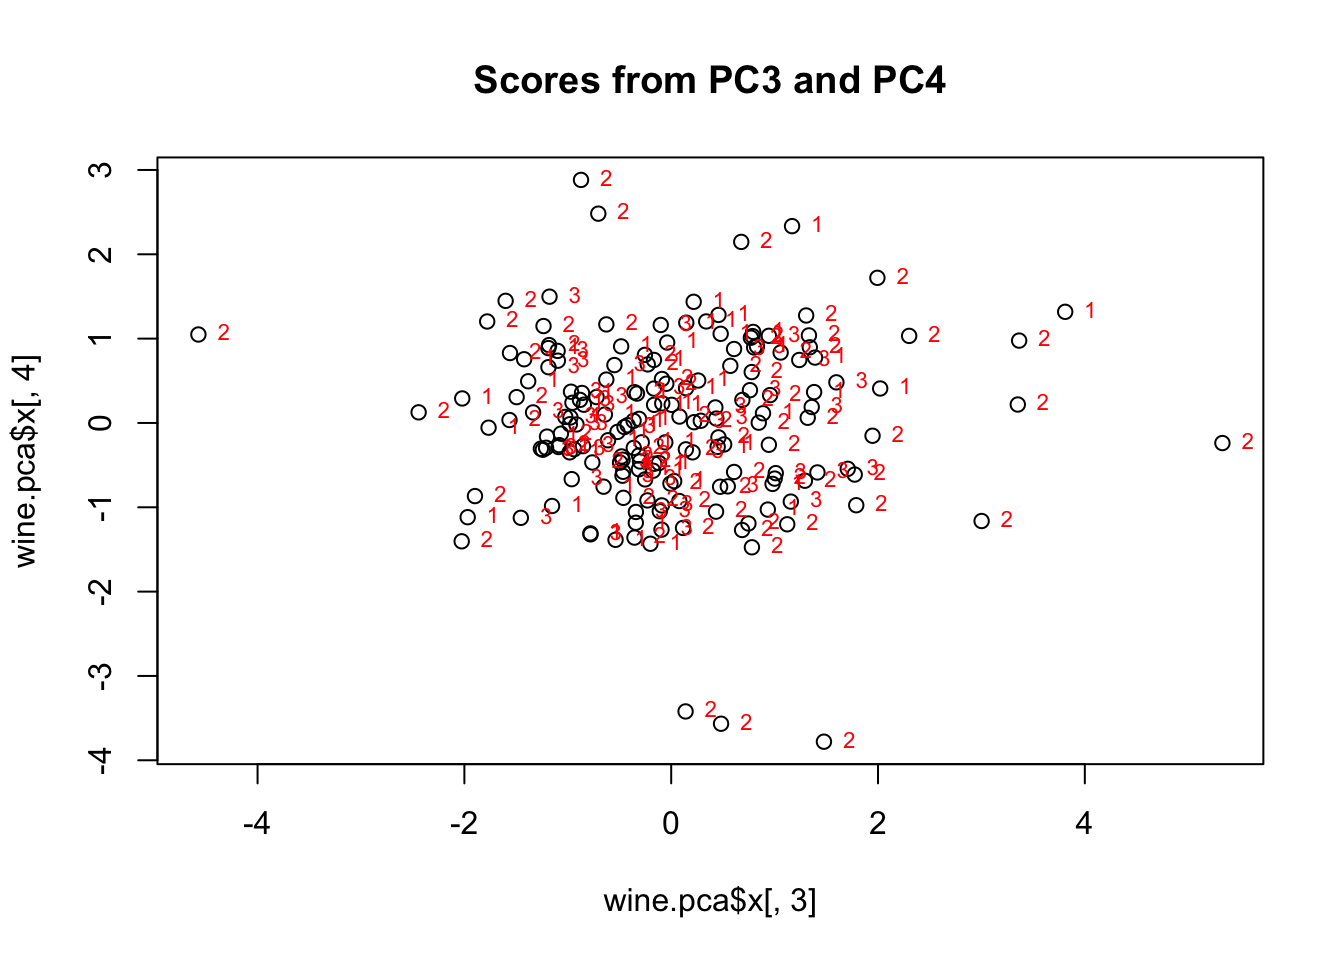
Figure 8.5: Scatterplot of principal component scores for three wine cultivars (1, 2, 3). The third principal component scores are on the x axis, and the fourth principal component scores are on the y axis. All three cultivars primarily group in the center, with some outliers, mostly from cultivar 2.
8.6 PCA on raw data
#Perform PCA on the raw data
wine.pca.raw <- prcomp(wine[,2:14])

# print summary of the Raw PCA
summary(wine.pca.raw)
## Importance of components:
## PC1 PC2 PC3 PC4 PC5 PC6 PC7
## Standard deviation 314.9632 13.13527 3.07215 2.23409 1.10853 0.91710 0.5282
## Proportion of Variance 0.9981 0.00174 0.00009 0.00005 0.00001 0.00001 0.0000
## Cumulative Proportion 0.9981 0.99983 0.99992 0.99997 0.99998 0.99999 1.0000
## PC8 PC9 PC10 PC11 PC12 PC13
## Standard deviation 0.3891 0.3348 0.2678 0.1938 0.1452 0.09057
## Proportion of Variance 0.0000 0.0000 0.0000 0.0000 0.0000 0.00000
## Cumulative Proportion 1.0000 1.0000 1.0000 1.0000 1.0000 1.00000screeplot(wine.pca.raw)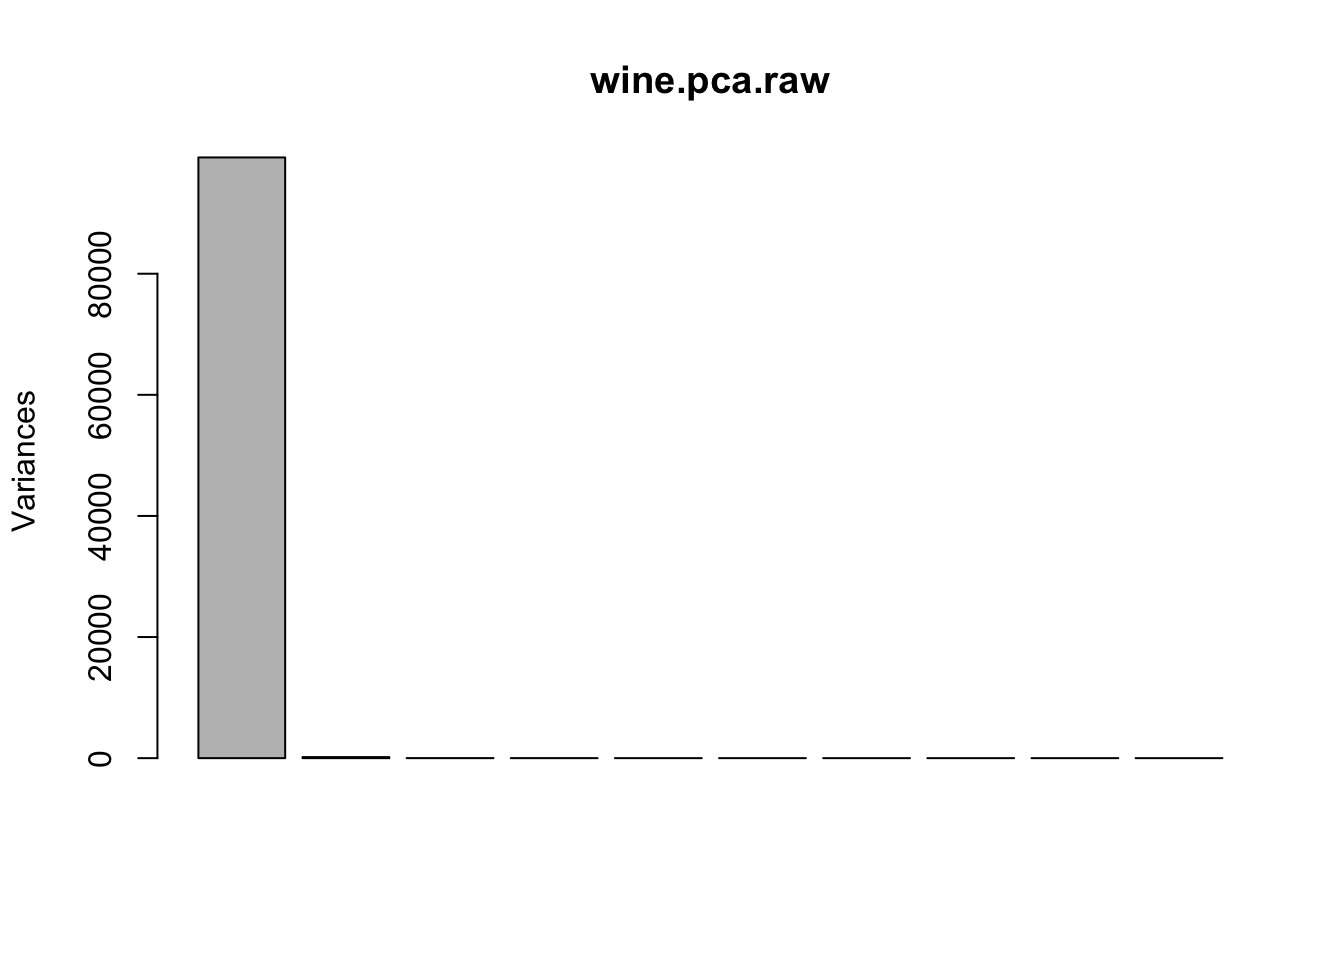
Figure 8.6: Screeplot summary of variances in raw data.
# Examine the loadings from the raw data
wine.pca.raw$rotation
## PC1 PC2 PC3 PC4 PC5
## alcohol -0.0016592647 -1.203406e-03 -0.016873809 0.141446778 0.020336977
## malic 0.0006810156 -2.154982e-03 -0.122003373 0.160389543 -0.612883454
## ash -0.0001949057 -4.593693e-03 -0.051987430 -0.009772810 0.020175575
## alk 0.0046713006 -2.645039e-02 -0.938593003 -0.330965260 0.064352340
## Mg -0.0178680075 -9.993442e-01 0.029780248 -0.005393756 -0.006149345
## totphen -0.0009898297 -8.779622e-04 0.040484644 -0.074584656 0.315245063
## flavan -0.0015672883 5.185073e-05 0.085443339 -0.169086724 0.524761088
## nonflavphen 0.0001230867 1.354479e-03 -0.013510780 0.010805561 -0.029647512
## proantho -0.0006006078 -5.004400e-03 0.024659382 -0.050120952 0.251182529
## color -0.0023271432 -1.510035e-02 -0.291398464 0.878893693 0.331747051
## hue -0.0001713800 7.626731e-04 0.025977662 -0.060034945 0.051524077
## OD -0.0007049316 3.495364e-03 0.070323969 -0.178200254 0.260639176
## proline -0.9998229365 1.777381e-02 -0.004528682 -0.003112916 -0.002298569
## PC6 PC7 PC8 PC9 PC10
## alcohol -0.194120104 0.923280337 -2.848207e-01 -8.660061e-02 2.245000e-03
## malic -0.742472963 -0.150109941 6.467447e-02 -1.566214e-02 1.850935e-02
## ash -0.041752912 0.045009549 1.493395e-01 -7.364985e-02 8.679965e-02
## alk 0.024065303 0.031526583 -1.515391e-02 -2.044578e-03 -3.554028e-03
## Mg 0.001923782 0.001797363 3.552212e-03 1.963668e-03 4.051542e-05
## totphen -0.278716809 -0.020185710 1.772379e-01 -2.556729e-01 -8.471951e-01
## flavan -0.433597955 -0.038868518 2.481166e-01 -3.783067e-01 5.201384e-01
## nonflavphen 0.021952834 -0.004665483 -6.497968e-03 -3.675204e-02 -3.771319e-02
## proantho -0.241884488 -0.309799487 -8.704332e-01 5.152017e-02 -9.722752e-03
## color -0.002739609 -0.112836514 8.128692e-02 9.902908e-02 2.314712e-02
## hue 0.023776167 0.030819813 2.951904e-03 -3.306512e-02 3.846983e-02
## OD -0.288912753 0.101973518 1.867145e-01 8.737465e-01 -1.701708e-02
## proline 0.001212255 -0.001076189 -1.034095e-05 7.255852e-05 -4.926638e-05
## PC11 PC12 PC13
## alcohol -0.0149715080 -1.565141e-02 8.029245e-03
## malic -0.0231876506 6.729555e-02 -1.109039e-02
## ash 0.9540106426 -1.320630e-01 -1.736857e-01
## alk -0.0528216953 5.393806e-03 1.939563e-03
## Mg -0.0030248882 6.208885e-04 2.284536e-03
## totphen 0.0088016070 3.882903e-03 -2.669144e-02
## flavan -0.1332046120 -3.748803e-02 6.959853e-02
## nonflavphen 0.1991789841 1.475524e-01 9.664662e-01
## proantho 0.1356214601 -1.311883e-02 -1.760357e-02
## color -0.0098196717 5.035557e-02 -4.632943e-03
## hue 0.0975106606 9.755619e-01 -1.665508e-01
## OD 0.0284851062 1.163025e-02 4.419224e-02
## proline -0.0002404522 -9.999951e-05 3.626701e-05# Save the variable loadings to a .csv file
#write.csv(wine.pca.raw$rotation, file="wine_pca_rawloadings.csv")
# Biplot which shows the loadings in the first 2 principal components (raw data)
biplot(wine.pca.raw)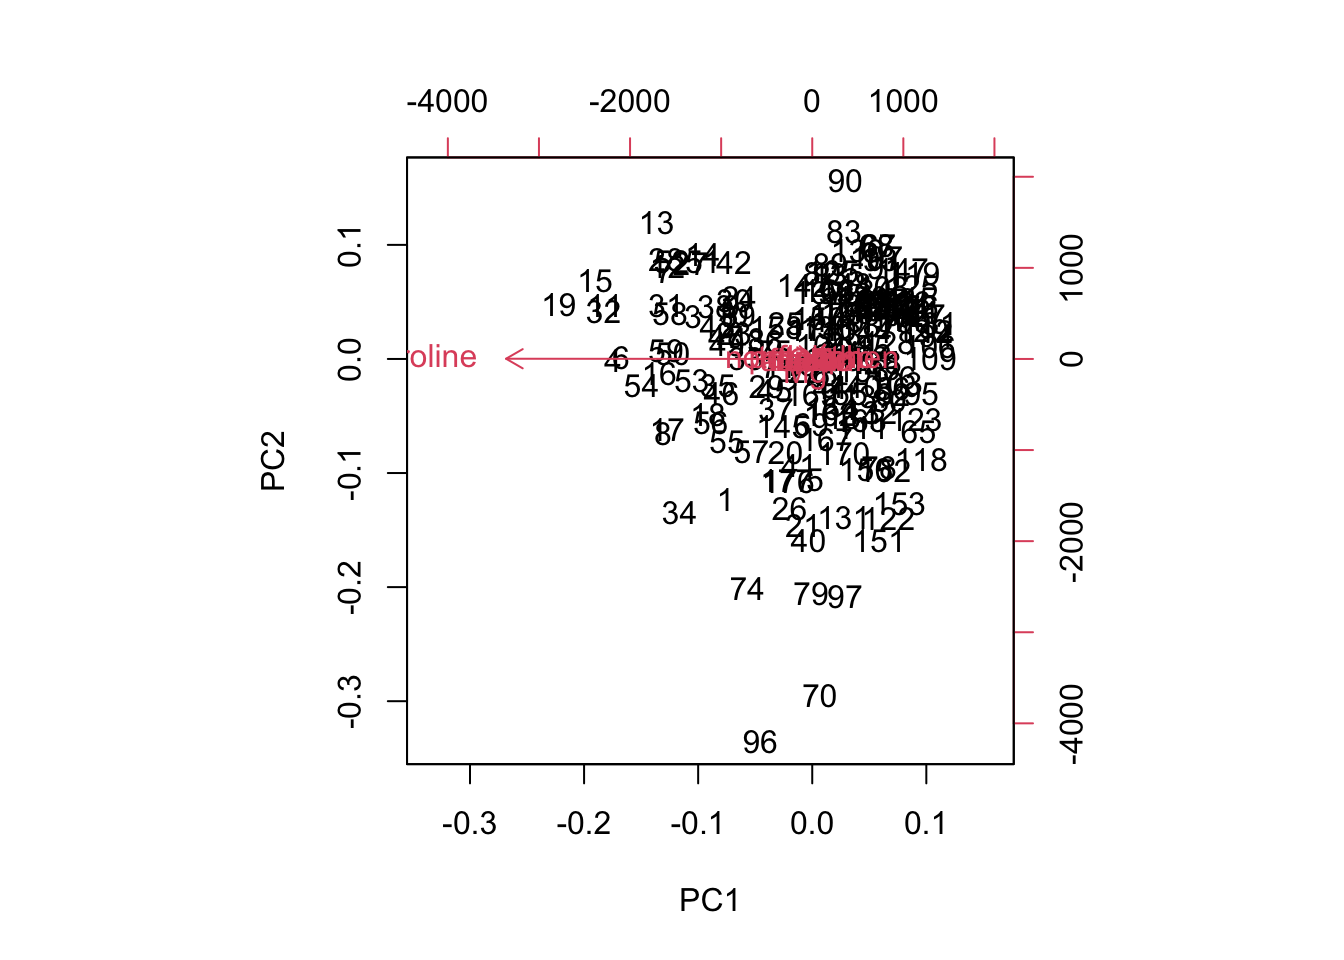
Figure 8.7: Biplot of the first two principal components of unstandardized (raw) data for comparison.